Welcome to the world of unconventional economic indicators! Our subject today is a remarkable, yet delectably straightforward, economic tool. It’s as simple as your lunchtime favorite: a Big Mac. This hamburger, popularized by McDonald’s, is not merely a fast-food icon. In the hands of economists, it becomes an ingenious measure of purchasing power parity (PPP). Intrigued? Let’s venture into the deliciously complex realm of the Big Mac Index.
Understanding the Big Mac Index
The Big Mac Index, invented by The Economist in 1986, is a creative and informal way of measuring purchasing power parity between two currencies. In essence, it uses the price of a Big Mac as a benchmark. The underlying assumption is that identical goods should cost the same in different countries, considering the exchange rate. For instance, if a Big Mac is more expensive in one country compared to another, it may indicate that the former’s currency is overvalued.
A Slice of History
The origins of the Big Mac Index are rooted in The Economist magazine’s quest for a lighthearted, user-friendly way to explain the concept of PPP. Since its inception in 1986, the index has been updated annually, offering a flavorful perspective on global economic trends. While it was initially conceived as a bit of a jest, it’s now widely recognized and frequently referenced, showcasing the unexpected but palatable convergence of fast food and economics.
🔗 You can delve deeper into the history here.
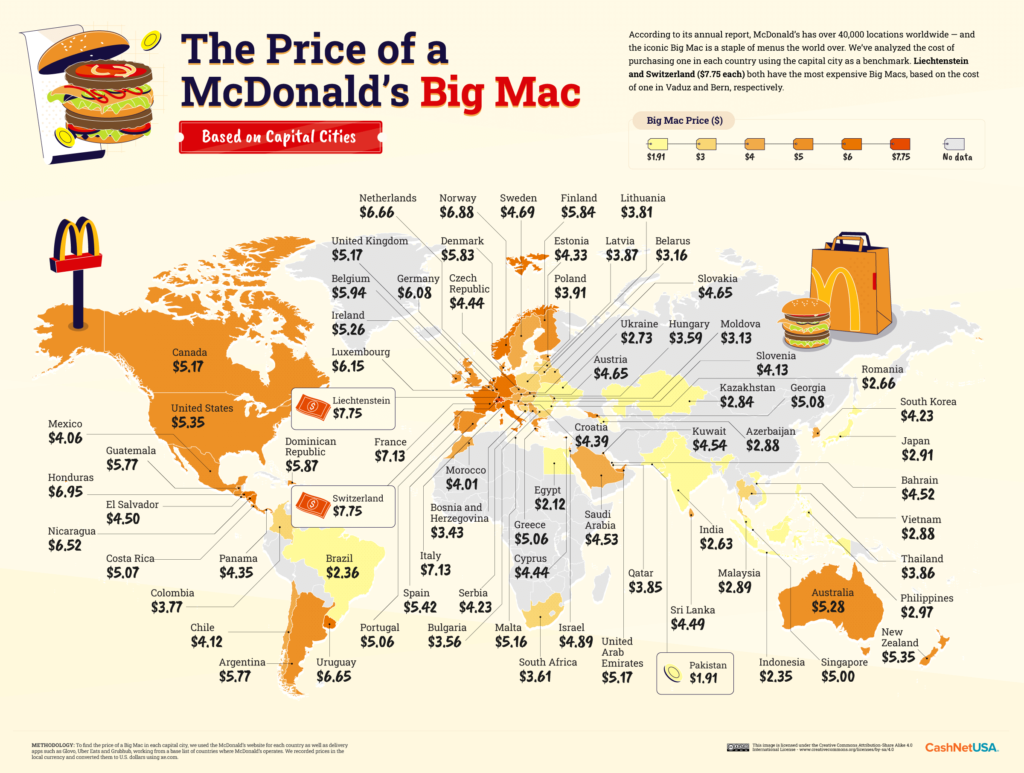
The latest report hasn’t been published yet but we’ve done some quick calculation how it might look this year once published. Below list is based on information (prices, salaries) available online.
Six Most Expensive
- 🇨🇭 Switzerland – $7.50
- 🇳🇴 Norway – $7.20
- 🇸🇪 Sweden – $6.90
- 🇺🇸 United States – $6.50
- 🇨🇦 Canada – $6.30
- 🇦🇺 Australia – $6.10
Six cheapest
- 🇿🇦 South Africa – $2.10
- 🇪🇬 Egypt – $2.20
- 🇮🇳 India – $2.30
- 🇵🇰 Pakistan – $2.40
- 🇮🇩 Indonesia – $2.50
- 🇲🇾 Malaysia – $2.70
Six fastest earned
- 🇱🇺 Luxembourg – 9 minutes, $6.80
- 🇳🇴 Norway – 12 minutes, $7.20
- 🇨🇭 Switzerland – 13 minutes, $7.50
- 🇺🇸 United States – 15 minutes, $6.50
- 🇩🇰 Denmark – 16 minutes, $6.00
- 🇦🇺 Australia – 18 minutes, $6.10
Six slowest earned
- 🇨🇺 Cuba – 6 hours, $6.00
- 🇲🇼 Malawi – 5.5 hours, $2.60
- 🇳🇬 Nigeria – 5 hours, $3.10
- 🇲🇳 Mongolia – 4.7 hours, $2.80
- 🇧🇩 Bangladesh – 4.5 hours, $2.30
- 🇬🇭 Ghana – 4 hours, $3.00
Similar indexes
There are several other indexes which, like the Big Mac Index, use the prices of common items around the world to compare purchasing power and the cost of living. Here are a few examples:
Starbucks Tall Latte Index: This index compares the cost of a Starbucks tall latte in different countries. Similar to the Big Mac Index, it gives a sense of the cost of living and purchasing power in each country.
KFC Index: In Africa, the KFC Index is used similarly to the Big Mac Index, as KFC outlets are more common in Africa than McDonald’s.
The Economist’s iPad Index: This index compares the price of an iPad in different countries, offering another way to look at global purchasing power parity.
Coca-Cola Index: This index compares the price of a can of Coca-Cola in various countries. This gives an insight into the differences in price levels between countries.
